Here is an overview of how to monitor AWS resources with CloudWatch:
1. Enabling CloudWatch
The first step in monitoring your AWS resources with CloudWatch is to enable it. You can do this by going to the CloudWatch console and following the setup instructions. Once you have enabled CloudWatch, you can begin monitoring your resources.
2. Defining Metrics
CloudWatch allows you to define custom metrics for your resources. You can create metrics for EC2 instances, RDS databases, Lambda functions, and many other AWS resources. These metrics can be used to monitor and track various aspects of your environment, such as CPU usage, memory usage, network traffic, and more.
To define metrics in CloudWatch, you can use the AWS Management Console, the AWS CLI, or the CloudWatch APIs. Once you have defined your metrics, CloudWatch will begin collecting data on them.
3. Creating Alarms
Once you have defined your metrics, you can create alarms in CloudWatch to trigger actions based on certain thresholds. For example, you can create an alarm to send an email or SMS message if CPU usage on an EC2 instance exceeds a certain threshold.
To create an alarm in CloudWatch, you can use the AWS Management Console, the AWS CLI, or the CloudWatch APIs. You will need to define the metric that the alarm is based on, the threshold that triggers the alarm, and the action that should be taken when the alarm is triggered.
4. Monitoring Logs
CloudWatch also allows you to monitor logs from various sources, including AWS services and custom applications. You can use CloudWatch Logs to monitor and analyze logs in real-time, and to set up alerts and notifications based on specific patterns or events.
To monitor logs in CloudWatch, you will need to configure log groups and log streams. A log group is a collection of log streams, and a log stream is a sequence of log events that share the same source. Once you have configured your log groups and log streams, you can begin monitoring your logs in CloudWatch.
5. Visualizing Data
CloudWatch provides various tools for visualizing your data, including graphs, dashboards, and charts. You can use these tools to gain insights into your environment and to identify trends and patterns.
To create a dashboard in CloudWatch, you can use the AWS Management Console or the CloudWatch APIs. You will need to select the metrics that you want to display on the dashboard and configure the layout of the dashboard.
6. Using CloudWatch APIs
Finally, you can use the CloudWatch APIs to programmatically monitor your AWS resources and to integrate CloudWatch with other AWS services and third-party tools. The CloudWatch APIs allow you to automate many of the tasks involved in monitoring your AWS resources and to create custom workflows and applications.
To use the CloudWatch APIs, you will need to generate an API key and configure your application or workflow to use the API key. You can then use the CloudWatch APIs to retrieve metrics, create alarms, monitor logs, and more.
Conclusion
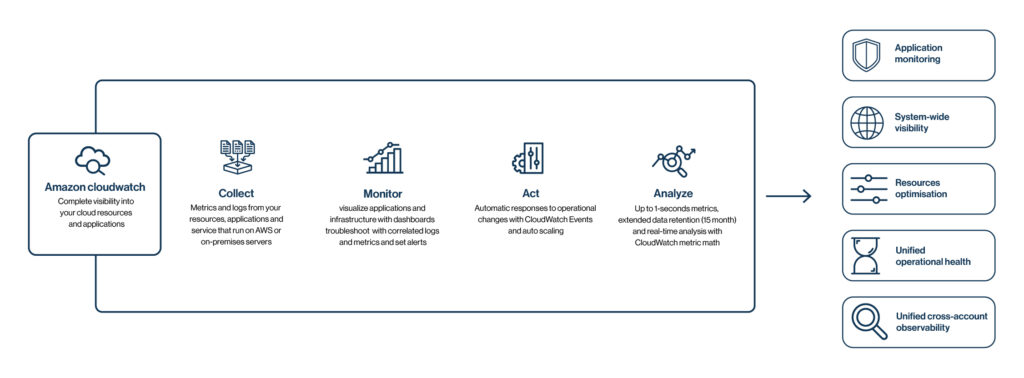
In conclusion, AWS CloudWatch is a powerful tool for monitoring and tracking your AWS resources and applications. By leveraging CloudWatch’s monitoring capabilities, you can gain insights into your environment, optimize resource utilization, and improve the overall performance and reliability of your AWS infrastructure. By following the steps outlined in this blog, you can begin monitoring your AWS resources with CloudWatch and start gaining valuable insights into your environment.